Microsoft Excel Training:
Excel Crash Course: Grow Better with Microsoft Excel Skills
Learn how to import, clean, and manage large data sets in HubSpot Academy’s Excel Crash Course! Explore data analysis essentials such as table creation, data filtering, and pivot table use. Create stunning charts and graphs for effective data visualization and storytelling.
Who is this for?
- Professionals wanting to save time through learning to work with data efficiently in Excel
- Business owners looking to improve data analysis skills using Excel
- Marketers interested in unlocking insights and creating impactful visuals using Excel
What you'll learn
- Become proficient in importing and cleaning large data sets with Excel
- Analyze data using formulas, pivot tables, and data filters
- Learn data visualization and create stunning charts with Microsoft Excel
Includes
Reporting & Performance
Watch preview
Instructors

GoSkills
GoSkills.com is an online learning company that helps anyone learn business and technology skills to reach their personal and professional goals. With a GoSkills membership, learners have access to convenient bite-sized courses taught by world-class experts.

Dan Gorgone
Dan has created over 50 online courses about marketing, business growth, UX, and more. He has over a decade of experience developing courses and workshops for companies including MarketingProfs, Mixergy, Treehouse, and Full Sail University.

Lydia Uys
Lydia is a Chartered Accountant and has experience in financial management, lecturing, and consulting. She currently creates content for GoSkills and loves spending time with family and friends.
Curriculum
Working With Data in Excel
Lesson - 23 min
Read more
Lesson instructor: GoSkills In this lesson, you will learn how to import data into Excel and use formulas.
See full details Start course 
Analyzing Data in Excel
Lesson - 34 min
Read more
Lesson instructor: GoSkills In this lesson, you will learn the value of tables and how to work with table’s functionality.
See full details Start course 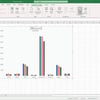
Visualizing Data in Excel
Lesson - 22 min
Read more
Lesson instructor: GoSkills In this lesson, you will learn how to create your own metrics dashboard in Excel.
See full details Start course 
Automating the Process
Lesson - 7 min
Read more
Lesson instructor: GoSkills In this lesson, you will learn how to update your dashboard and perform regular edits by copying a file to a folder.
Start course 
Excel for Marketers Course Next Steps
Lesson - 8 min
Read more
Lesson instructor: GoSkills Excel for Marketers Course Next Steps
Start course
More like this


%204.33.04%E2%80%AFp.%C2%A0m..png?length=400)
Course transcript
Excel for Marketers Course: Introduction Video [Transcript]
Hi, and welcome to this Excel for marketers course presented by GoSkills in partnership with HubSpot Academy. Microsoft Excel is like the Swiss Army knife of software tools, helping marketers become more efficient and accurate in their jobs every day. This is true for marketers across all industries across the globe. You only need a basic understanding of excel to benefit from this crash course, and each video will show you everything you need to know. On the other hand, if you've never worked with Excel before, GoSkills free Excel in an hour course can quickly get you up to speed.
Now for the Excel pros out there, you will be able to pick up some very cool tips and tricks from this course to make your work even more efficient. But for everyone, the objective of this course is to show you how to efficiently use Excel to gain data-driven marketing insights from
data. Large data sets can be complicated to work with, but our aim is to save you time and make sure you are more efficient when working with Excel. So by the end of the short course, you will be able to build your own dashboard just like this one using traffic data from Google Analytics.
This course has three lessons, plus a bonus video. Let me tell you more about it. In the working with data lesson, you'll learn how to import and clean data by learning time-saving techniques and functions like Count If and V look-Up. In the analyzing data lesson, we'll get into the
meat of the course as we delve into tables, sorting and filtering data. We will also cover critical topics such as conditional formatting and the often feared but compelling pivot tables. In the visualizing data lesson, we will pull it all together with some beautiful charts you can create with your data, and you'll walk away with the skills to create your own custom dashboards.
Finally, the bonus video will teach you how to automate the entire process to save you even more time. Here, you will learn how to use a power query to update your dashboard automatically when you add data to your spreadsheet.
So if you enjoy this course and you'd like to learn more about Excel, visit GoSkills and get a free seven-day trial to learn more about Excel and many of our other courses. I hope you enjoy the course.
Why learn with Academy?

It's Free

It's personalized

It's global
Share this course


